Duong's portfolio
Starting my journey as a curious and ambitious individual, I am eager to learn and explore different techniques in data analysis. With a passion for data and a drive to make a difference, I compiled some highlights from completed projects below.
Feel free to explore the code and report! I am open to comments, and if you find them useful, a credit for reference is appreciated


Data Science, Machine Learning & AI
Demand Prediction Model with SHAP Interpretation
The objectives of the analysis are: Understand demand across different price ranges, brands, shops, and seasons (1), Build a predictive model to forecast demand (2), and Explain observations and attributed variables importance in the model (3).
Tools used: Python, RandomForestRegressor, TreeExplainer, SHAP
Text Classification Model with BERT and SHAP
The objectives of the analysis are: Transform the text database into tokens for interpretation (1), Utilize BERT deep learning model in text analysis (2), and Explain texts importance in each observation (3).
Tools used: Python, BERT, transformer tokenizer, SHAP


Hotel room price prediction - Bayesian approach
In the Bayesian Data Analysis course, we, Duong and Vee, applied the knowledge acquired to build predictive models for hotel prices using R. The dataset was extracted from R with information on historical prices and booking details. By approaching with both non-hierarchical and hierarchical Bayesian models, we help optimize price predictions for managerial implications and for travelers to understand the price drivers.
Read the brief presentation embedded below:
Predict Problematic Internet Usage with Federated Learning
Data privacy has been emphasized with the prevalence of data and AI. Federated Learning allows models to train locally, which is a game-changer for industries with sensitive data.
Through a non-parametric federated learning approach, I solve the challenge in modelling internet usage risks among children.
Business Intelligence & Report
Each data collected by business can make a significant contribution to its value; however, this is not universally utilized. Business intelligence (BI) is a vital tool for organizations seeking to transform raw data into actionable insights. Depending on the business needs, the insights could be related to sales, financials, operations, safety measures, and so on.
This example report highlights key performance indicators (KPIs) and explores future sales prospects of Wish platform in August 2020. These visuals, created in PowerBI, enable efficient monitoring of trends and support data-driven decision-making.
Tools used: Power BI
Focus area: KPI tracking, sales report, data storytelling
Projects
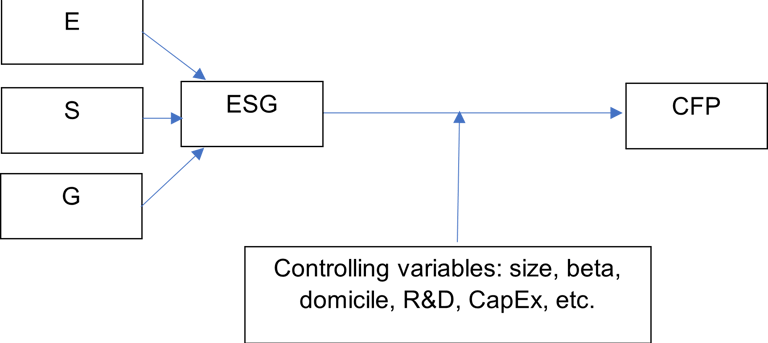
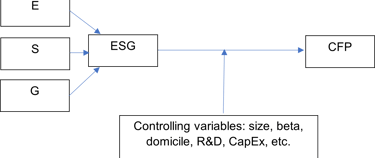
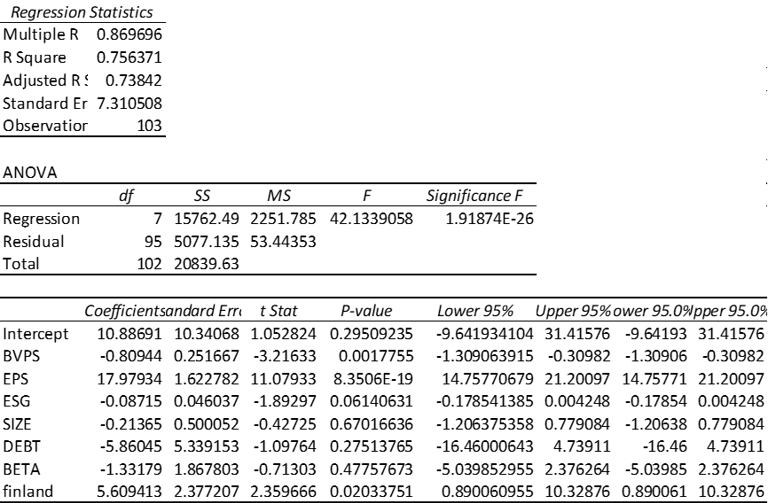
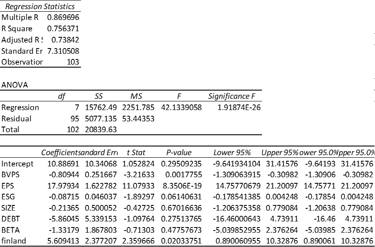
Financial analysis - ESG and CFP
This project is part of my analysis in my Bachelor's thesis, which consisted of literature and different hypotheses regression analysis of ESG and different firm characteristics on stock prices as an indicator of financial performance. The whole process includes extensive data collection, cleansing, dimensionality reduction, and regression on Excel.